Guolin Lai
DSC8240 Course Web
Personal Statement
Chapter 1 Summary
Chapter 2 Report
Breakeven Analysis
Price & Demand Relationship
Quantity Discounts Decision
Hedging Investment Risk
Time Value of Money
Enterprise DSS
Time Series Forecasting
DSS Development Project
Simulation Model Examples
Government Contract Bidding
GFAuto Model
Customer Loyalty
Game of Craps
Monte Carlo Simulation
Optimization Modeling
Term Project
Business Intelligence Research
What is Monte Carlo Simulation?
When we use the word simulation, we refer to any analytical method meant to imitate a real-life system, especially when other analyses are too mathematically complex or too difficult to reproduce.
Without the aid of simulation, a spreadsheet model will only reveal a single outcome, generally the most likely or average scenario. Spreadsheet risk analysis uses both a spreadsheet model and simulation to automatically analyze the effect of varying inputs on outputs of the modeled system.
One type of spreadsheet simulation is Monte Carlo simulation, which randomly generates values for uncertain variables over and over to simulate a model. Monte Carlo simulation was named for Monte Carlo, Monaco where the main attractions are casinos. Casinos contain games of chance such as roulette wheels, dice, and slot machines which all exhibit random behavior. The random behavior in games of chance is similar to how Monte Carlo simulation selects variable values at random to simulate a model. For each uncertain variable (one that has a range of possible values), the possible values are defined with a probability distribution. Below is an example of four different types of distributions:
 |
Normal Distribution - uses a mean and standard deviation to describe the distribution. | |
 |
Triangular Distribution - uses three easily identifiable values to describe a complete distribution It uses the minimum possible value, most likely value, and maximum possible value. | |
 |
Uniform Distribution - uses only two values to describe the full range of the distribution and assign probabilities for all the values in the range. It uses a maximum and minimum values. | |
 |
Lognormal Distribution – uses the standard deviation and mean to impose a lognormal distribution. | |
Monte Carlo Simulation, Sensitivity Analysis, and Scenario Analysis
|
Type
|
Description
|
| Monte Carlo Simulation | Probability: N way type of sensitivity analysis by randomly changing the uncertain input variables to simulate a model using probability distributions. |
| Sensitivity Analysis | One way analysis by changing one input variable to see the effect on the output variable(s). |
| Scenario Analysis | N-way Sensitivity Analysis by changing multiple input variables to see the effect on the output variable(s). |
Sensitivity analysis and scenario analysis can reveal incremental range of possible outcomes, but the analyses reveal some disadvantages --- time-consuming, results in a mountain of data, reveals what is possible, not what is probable. Ultimately, they lack the ability to know the range of possible outcomes and their likelihood of occurrence.
On the contrary, Monte Carlo simulation as a system uses random numbers to measure the effects of uncertainty on decision-making process. Advantages: inexpensive to evaluate decisions before implementation; reveals critical componentss of the system; and excellent tool for selling the need for change. Disadvantages: results are sensitive to the accuracy of input data; investment in time and resources.
How to use Monte Carlo Simulation to simulate a model
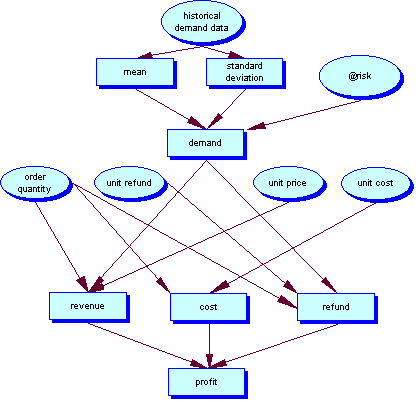
The five steps of model development (based upon Walton case from the book in Chapter 11)- Develop a system flow diagram

- Write an Excel spreadsheet to model the system
From historcial demand data, we run the Start BestFit from @Risk to get the sense of fitted distribution. Then we choose one best fit for the historical demand data. In this example, we chose normal distribution and then got the mean and standard deviation of the historical demand data. Using @Risk functions, we further randomly generated the demand and incorporated it in an Excel spreadsheet model.
Inputs:
- Unit cost
- Unit price
- Unit refund
- Mean
- Stdev
- Order quantity
- Demand
Outputs:
- Profit
- Use @Risk to model uncertainty
Follow the respective procedures of @Risk to simulate the model.
- Run the simulation and analyze the output. Click
here to view the model.
- Improve the model and/or make decisions
Why is Monte-Carlo simulation appropriate for managing uncertainty
- Monte-Carlo simulation randomly generated input decision values rather than arbitrarily decided ones
- Monte-Carlo simulation describes uncertain inputs by their probability distribution as evidenced by the example of books order in Chapter 11.
- Monte-Carlo simulation provides a far more efficient and effective sensitivity analysis mechanisms.
- Monte-Carlo simulation facilitates the input accuracy check.
- Monte-Carlo simulation such as Crystal and @Risk provides a set of more visual and meaningful outputs (graphs, charts, input and output statistics report, and etc.) for further analysis upon the appropriateness of the proposed model.