Guolin Lai
DSC8240 Course Web
Personal Statement
Chapter 1 Summary
Chapter 2 Report
Breakeven Analysis
Price & Demand Relationship
Quantity Discounts Decision
Hedging Investment Risk
Time Value of Money
Enterprise DSS
Time Series Forecasting
DSS Development Project
Simulation Model Examples
Government Contract Bidding
GFAuto Model
Customer Loyalty
Game of Craps
Monte Carlo Simulation
Optimization Modeling
Term Project
Business Intelligence Research
Background
Objective Hierarchies
Variables and Attributes
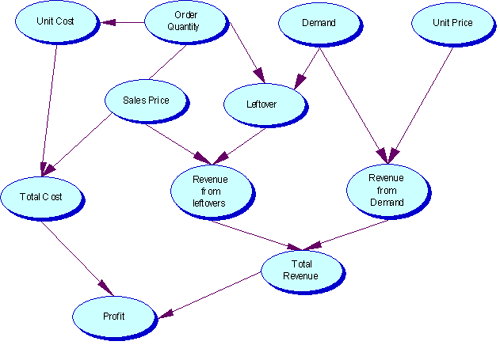
Influence Diagram
Mathematical Representation
Testing and Validation
Implementation and Use
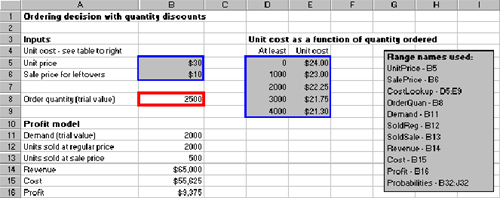
Samís Bookstore, with many locations across the United States, places orders for all of the latest books and then distributes them to individual bookstores. Sam’s is very uncertain about the demand for this book – it estimates that demand could be anywhere from 500-4500. However, dDue to quantity discounts, the unit cost for all books it orders depends on the number ordered:
- If the number ordered is less than 1000, the unit cost is $24
- For at least 1000 copies the price is $23
- For at least 2000 copies the price is $22.25
- For at least 3000 copies the price is $21.75
- For at least 4000 copies the price is $21.30
Also, as with most hardback novels, the desired book will eventually
come out in paperback. Therefore, if Sam’s has any hardbacks left
when the paperback comes out, it will put them on sale for $10, at which
price it believes all leftovers will be sold.
Objective
Hierarchies
Sublime objective: Sam’s needs a model to help it order the
appropriate number of any title.
Current objective: How many copies of this hardback novel should
Sam’s order from the publisher?
|
Variable
|
Variable Type
|
How Measured
|
Related to
|
| Unit Cost | Input Variable | $ | Total Cost |
| Unit Price | Input Variable | $ | Total Revenue |
| Unit Sales Price | Input Variable | $ | Total Cost |
| Order Quantity | Decision Variable | Numerical Value | Total Cost |

Books Sold Regularly = MIN(Order Quantity , Demand);
Books Sold at Sales = IF(Order Quantity > Demand, Order Quantity -
Demand,0);
Revunue = Books Sold Regulary * Unit Price + Books Sold at Sales *Sales
Price.
By using VLOOKUP function, we can find the appropriate unit cost from
the unit cost table and multiply it y the order quantity to obtain Total
Ordering Cost = VLOOKUP(Order Quantity ,Cost Lookup Table ,2) * Order
Quantity.
Profit = Revenue - Total Ordering Cost.

How many copies of this hardback novel should Sam’s order from the publisher?
The ordering decision depends not just on which demands are possible, but on which demands are likely to occur. The usual way to express this information is with a set of probabilities that sum to 1. We show one possible set on the next slide. Sam’s would need to estimate these probabilies, possibly on the basis of other similar novels it has sold in the past.

The ones shown indicate that Sam’s believes the most likely demands are 2000 and 2500, with other values on either side less likely. Now we can use these probabilities to find an expected profit for each order quantity. This expected profit is a weighted average of the profits in any row in the data table, using the probabilities as the weights. The easiest way to do this is to enter the formula =SUMPRODUCT(B20:J20,Probabilities) in cell B35 and copy it down to cell B43.
The largest of the expected profits, $12,250, corresponds to an order
quantity of 2000, so we would recommend that Sam’s order 2000 copies
of the book. This does not guarantee that Sam’s will make a profit
of $12,250 – the actual profit depends on the eventual demand –
but it represents a reasonable way to proceed in the face of uncertain
demand.
The model can be manipulated in Microsoft Excel.