Guolin Lai
DSC8240 Course Web
Personal Statement
Chapter 1 Summary
Chapter 2 Report
Breakeven Analysis
Price & Demand Relationship
Quantity Discounts Decision
Hedging Investment Risk
Time Value of Money
Enterprise DSS
Time Series Forecasting
DSS Development Project
Simulation Model Examples
Government Contract Bidding
GFAuto Model
Customer Loyalty
Game of Craps
Monte Carlo Simulation
Optimization Modeling
Term Project
Business Intelligence Research
Background
Objective Hierarchies
Variables and Attributes
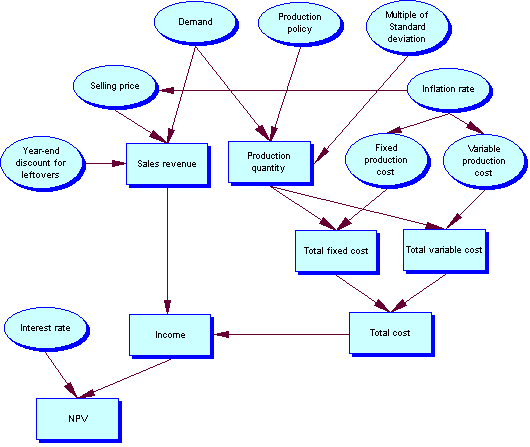
Influence Diagram
Mathematical Representation
Testing and Validation
Implementation and Use
Background
General Ford (GF) Auto Corporation is developing a new type of compact
car. This car is assumed to generate sales for the next 10 years. GF has
gathered information about the following quantities through focus group
with the marketing and engineering departments:
- Fixed cost of developing car
- Variable production cost
- Selling price
- Demand
- Production
- Interest rate
Objective
GF wants to develop a simulation model that will evaluate its NPV for
this new car over the 10-year time horizon.
|
Variable
|
Variable Type
|
How Measured
|
Related to
|
| Fixed production cost | Input Variable | Total Amount in $ | Fixed cost |
| Variable production cost | Input Variable | Total Amount in $ | Variable cost |
| Inflation rate | Input Variable | % | Variable cost |
| Selling price | Input Variable | $ | Sales revenue |
| Interest rate | Input Variable | % | Variable cost |
| Demand | Input Variable | Integer | Sales revenue |
| Production policy | Input Variable | Statement | Production quantity |
| Mutiple of Standard Deviation | Input Variable | Number | Production quantity |
| Year-end discount for leftover | Input Variable | $ | Sales revenue |

Mathematical
Representation
1, Use RISKNORMAL(inflation mean, inflation standard deviation) to get
variable cost inflation factors.
2, Use (demand mean + (production factor)*(demand standard devision))
to generate production quantity for year 1; and use ((year 1 demand) +
(production factor)*(demand standard deviation)) to generate the following
years' production quantities.
3, Use RISKNORMAL(demand mean, demand standard deviation) to generate
the demand in year 1.
4, Use RISKNORMAL(year 1 demand, demand standard deviation).
5, Use RISKNORMAL(variable production cost mean, variable production cost
standard deviation) to generate the variable production cost for the following
years.
6, Price = (year 1 price)*(inflation factor).
7, Production cost = (production quantity) * (variable production cost).
8, The revenue in any year is calculated in one or two possible ways.
If demand is greater than the production quantity, revenue is the selling
price multiplied by the production quantity. Otherwise, if demand is less
than the production quantity, revenue is the selling price multiplied
by the demand, plus the discounted sales price multiplied by the number
of cars left over.
9, Fixed cost = RISKNORMAL(fixed cost mean, fixed cost standard deviation)
* 1000.
10, NPV = (interest rate, revenues).
11, total NPV = RISKOUTPUT() + revenues - fixed costs - production costs.
The model can be manipulated in Microsoft Excel.
Please click here to view the Excel Model.