Guolin Lai
DSC8240 Course Web
Business
Modeling for Decision Support
Personal Statement
Chapter 1 Summary
Chapter 2 Report
Breakeven Analysis
Price & Demand Relationship
Quantity Discounts Decision
Hedging Investment Risk
Time Value of Money
Enterprise DSS
Time Series Forecasting
DSS Development Project
Simulation Model Examples
Government Contract Bidding
GFAuto Model
Customer Loyalty
Game of Craps
Monte Carlo Simulation
Optimization Modeling
Term Project
Business Intelligence Research
DSS Development Project (Firm Demand)
Objective Hierarchies
Variables and Attributes
Influence Diagram
Mathematical Representation
Testing and Validation
Implementation and Use
Objective Hierarchies
Demand forecasting plays a crucial role in making the decision of a firm's
manufacturing or retail store's order.
Such techniques as regression analysis, and time series forecasting (StatsPro) were employed.
Variables
and Attributes
AFD include:
- Exogenous Demand: Macro-Economic Influences
- Endogenous Demand: Industry Behavior
- Actual average industry demand
- Average price
- Average advertising
- Average advertising one quarter ago
- Average advertising two quarters ago
- Average R&D expenditures one quarter ago
- Average R&D expenditures two quarters ago
NSOM include:
- Pricing
- Promotion
- Quality
- Loyalty
Inputs for NSOM:
- Actual normalized share of market
- Relative price
- Relative advertising expenditure
- Relative advertising expenditure one quarter ago
- Relative advertising expenditure two quarters ago
- Relative R&D expenditure one quarter ago
- Relative R&D expenditure two quarters ago
- Normalized share of market
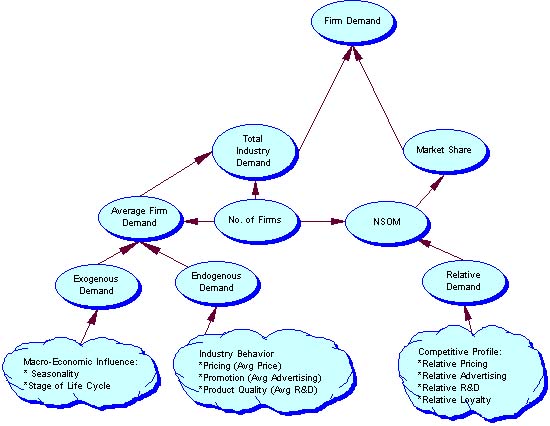
- stimate Exogenous Demand using time series analysis
- Estimate Endogenous Demand using regression analysis
- Estimate NSOM using regression analysis = Firm Demand / Avg Firm Demand
- Combine above two to get AFD (AFD = Exogenous Demand + Endogenous Demand)
- Combine AFD and NSOM ( Firm Demand = AFD * NSOM = {(T*S) + (B0 + B1*Avg Pricing + B2*Avg Advertising + )
- Exogenous demand = "Base demand" * Seasonal effects where estimation of base demand and seasonal demand is done using Time Series Decomposition
- Endogenous demand = Influence of aggregate industry behavior
The model can be manipulated in Microsoft Excel.