Guolin Lai
DSC8240 Course Web
Personal Statement
Chapter 1 Summary
Chapter 2 Report
Breakeven Analysis
Price & Demand Relationship
Quantity Discounts Decision
Hedging Investment Risk
Time Value of Money
Enterprise DSS
Time Series Forecasting
DSS Development Project
Simulation Model Examples
Government Contract Bidding
GFAuto Model
Customer Loyalty
Game of Craps
Monte Carlo Simulation
Optimization Modeling
Term Project
Business Intelligence Research
Background
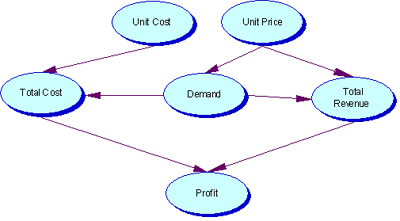
Objective Hierarchies
Variables and Attributes
Influence Diagram
Mathematical Representation
Testing and Validation
Implementation and Use
Background
The Links Company sells its golf clubs at golf outlet stores throughout
the United States. The company knows that demand for its clubs varies
considerably with price. In fact, the price has varied over the past 12
months, and the demand for each price level has been observed.
Objective
Hierarchies
The company would like to estimate the relationship between demand and
price so as to use the estimated relationship to answer the following
questions.
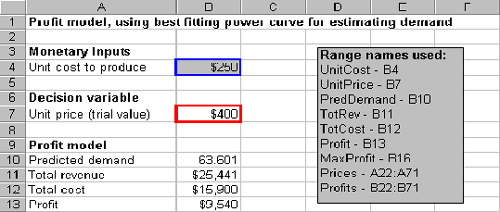
- Assuming the unit cost of producing a set of clubs is $250 and the price must be a multiple of $10, what price should Links charge to optimize its profit?
- How does the optimal price depend on the unit cost of producing a set of clubs?
- Is the model an accurate representation of reality?
|
Variable
|
Variable Type
|
How Measured
|
Related to
|
| Unit Cost to Produce | Input Variable | $ | Total Cost |
| Unit Price | Decision Variable | $ | Demand, Total Revenue |
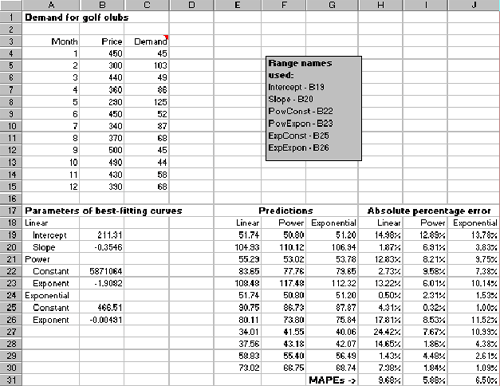
In Microsoft Excel, first use Chart tool - Scatterplot to get a chart
depicting the relationship between price and demand; After creating this
chart, select the Chart/Add Trendline menu item, which will allow several
different curves onto the scatterplot. We will consider the linear, power
and exponential curves, defined by the general equations where y and x,
a general output and input, correspond to demand and price.
Linear: y = a+bx
Power: y = ax^b
Exponential: y = ae^(bx)
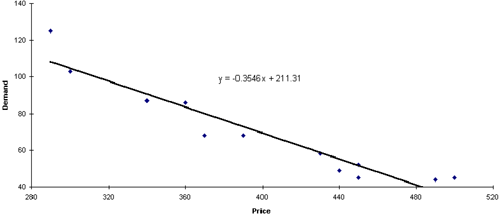
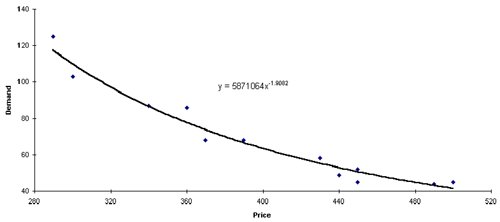
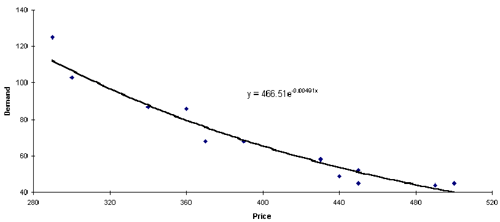
Each of above curves provides the best-fitting member of its “family” to the demand/price data. To get the best overall, we need to find the mean absolute percentage error (MAPE) for each of the three curves. To do this, for any price in the data set and any of the three curves, we first predict demands by substituting the given price into the equation for the curve.
APE (Absolute Percentage Error) = (Oberserved Demand - Predicted Demand)
/ Observed Demand
The we average these values of the APE for any curve to get its MAPE.
We will consider the curve with the smallest MAPE as the best fit overall.
Predicted demands. Substitute observed prices into the linear, power, and exponential functions to obtain the predicted demands. Specifically, for Linear method, demand formula = Intercept + Slope * Price; for Power method, demand formula = Power Constant * Price ^ Power Exponential; and for Exponential method, demand formula = Exponential Constant * EXP(ExpExpon * Price).
Average percentage errors. Apply APE equation to calculate APEs.
MAPE. Average the APEs for linear, power and exponential
with the AVERAGE function to get the MAPEs.
The profit model will use the best-fitting power curve to predict demand
from price.
Predicted Demand = Power Constant * Unit Price^Power Exponential;
Total Revenue = Predicted Demand * Unit Price;
Total Cost = Predicted Demand * Unit Cost to produce;
Profit = Total revenue - Total cost.
Assuming the unit cost of producing a set of clubs is $250 and the price must be a multiple of $10, what price should Links charge to optimize its profit?
To see which price maximizes profit, we build the data table.
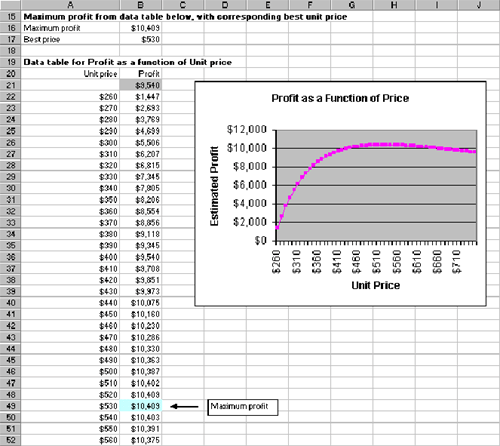
We can find the maximum profit and corresponding price in at least three
ways:
1) Read from the chart;
2) Scan down the data table for the maximum profit, which we indicate
in the figure;
3) Use Microsoft Excel’s most exotic features. One of these tools
is conditional formatting. Excel will scan the selected range and apply
a certain formatting to cells that meet certain conditions which you specify.
OFFSET(Profit at price 250,MATCH(Maximum Profit , Profit at price 260:Profit
at price 750,0),-1)
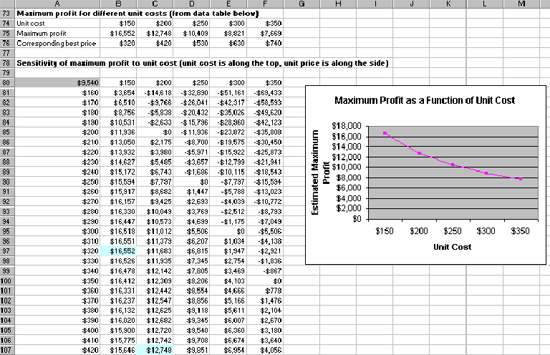
How does the optimal price depend on the unit cost of producing a set of clubs?
We can answer it with a two way data table, a data table with two inputs,
one along the left side and the other across the top row and a single
output. The two inputs for our problem are unit variable cost and unit
price, and the single output is profit. The following slide shows the
top part of the corresponding data table. Then we can create a chart of
maximum profit versus unit cost. The chart shows that maximum profit decrease,
but at a decreasing rate, as unit cost increases.
Is the model an accurate representation of reality?
No, the model is not an accurate representation of reality.
First, there is no real reason why golf club prices should be restricted to be multiples of $10. We required this only so we could use a data table to find the profit-maximizing price. Ideally, we would like to have a way to search over all possible prices to find the profit-maximizing price.
Second, possible flaw in our model is that implicit assumption that price is the only factor that influences demand. In reality, other factors such as advertising, the state of the economy, competitors prices, strength of competition and promotional expenses also influence demand.
Third, a final flaw in the model is that demand might not
equal sales. For example, if the actual demand for golf clubs during a
year is 70,000 but the company’s annual capacity is only 50,000,
the company would observe sales of only 50,000.
This would cause us to underestimate actual demand, and our curve fitting
method would produce biased predictions.
As these comments indicate, most models are not perfect, but we have to
start somewhere!
The model can be manipulated in Microsoft Excel.